
 |
HERALD OF THE RUSSIAN
|
Nonlinear Dynamics and the Problems of Prediction
G.G. Malinetskii and S.P. Kurdyumov
Discussion at the RAS Presidium
This scientific communication was discussed by RAS academicians, R.F. Ganiev, Yu.A. Izrael’, N.A. Kuznetsov, D.S. L’vov, G.A. Mesyats, R.T. Nigmatulin, N.A. Plate, D.V. Rundkvist, V.I. Subbotin, and S.Yu. Malkov, Dr. Sci. (Eng.) of the Center for Strategic Nuclear Forces at the Academy of Military Science.
Everyone takes an interest in forecasts, both the specialist and the man on the street. Both wish to know the extent of reliability of complex engineering structures like nuclear power stations, aircraft, and ocean liners, or to receive timely information about an approaching tsunami or an impending earthquake. In recent years, thanks to advances in nonlinear dynamics, risk management theory, and self-organized criticality theory, some fundamental limitations of forecasts were identified. These limitations were discussed at a RAS presidium meeting held at the end of 2000. The meeting’s deliberations formed the basis of the paper and discussion below.
The academic community and the Russian Academy of Sciences have a long and fine record of the study of prognostication problems. This paper looks at the contribution of nonlinear dynamics to the analysis of an information process like forecasting. Notably, it examines some fundamental restrictions on the predictability of complex systems, which were established in the last few decades, and discusses the risk management concept and the hypothesis of human algorithms in making a prognosis. Examples illustrating the application of these ideas to the forecasting of the behavior of complex social systems are given, and new possibilities opening up in this field are described.
PREDICTABILITY AND THE ANALYSIS OF COMPLEX SYSTEMS
A pendulum can serve as an illustration of some of the central ideas in forecasting (Fig. 1). Observations of this pendulum show that, with a 95% probability, its oscillations will be nonperiodic, and with a 5% probability we will see periodic movement. The result depends on the original momentum we give the pendulum. Let us start the pendulum and see what happens.
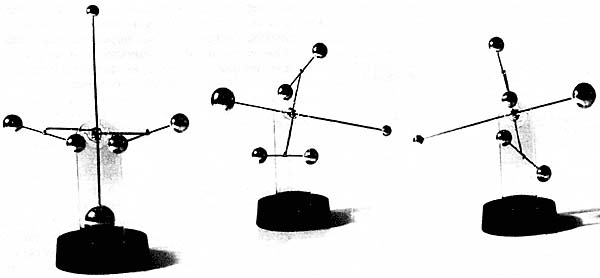 |
Рис. 1. Простейший непериодический маятник, демонстрирующий динамический хаос. Чтобы скомпенсировать трение, маятник снабжен магнитиками, а в основание игрушки помещены катушка и батарейка, создающие электромагнитное поле |
Dynamic Chaos and Fundamental Restrictions in Prognostication |
It would be more correct to say that for a given accuracy (arbitrarily large but finite) it is always possible to indicate a time interval for which predictions cannot be made. This interval is not so large, which is the whole point.
|
Before the 1960s, all processes were thought to fall into two broad classes. The former was described by dynamics systems, where the future was uniquely determined by the past. They were supposed to be fully predictable. The great Laplace said with reference to such systems-if his words are translated into our modern language-that, given sufficiently powerful computers, we can look arbitrarily far into the future and arbitrarily far into the past. The second class included processes where the future did not depend on the past. We roll dice, generating a number in no way connected with previous results.
In the 1970s, it became clear that there was a third, very important class of processes, formally described by dynamic systems, such as the pendulum in Fig. 1, but their behavior could only be predicted for a short time interval; later, the researchers would have to deal with statistics. A simple linear model can be developed for our pendulum, which will permit us to predict the position of, say, the small balls after five swings of the larger ball below them. However, there is no way we could predict their positions after sixty time intervals.
Ray Bradbury wrote a science fiction story in 1963 in which he in effect formulated the idea of dynamic chaos. In this story, an electioneering agent, after his candidate has won, sets out on a time travel. The firm that organizes his trip proposes a hunt for dinosaurs which became extinct long ago. One is expected to move along special paths so as not to disturb the complex texture of causal relations and change the future. However, the hero failed to meet this condition and accidentally squashed a golden butterfly. Upon his return, he found changes in the composition of the atmosphere, spelling rules, and election results. A barely noticeable motion caused the smaller dominoes to fall, which in turn caused larger dominoes to fall, and finally, the falling of giant dominoes led to a catastrophe. There was a precipitous buildup of deviations from the initial path, caused by the death of a butterfly (Fig. 2). Even small causes had large effects. Mathematicians refer to this property as initial-data sensitivity.
In the same year (1963), Nobel prize winner R. Feynman suggested that our ability to predict, even in a world ideally described by classical mechanics, was fundamentally limited. If we are to have a forecast horizon, «God is not to play dice,» adding some random terms to the equations describing our reality. We must not come down to the microworld level, where quantum mechanics describes the Universe in quantitative terms. Objects whose behavior cannot be predicted for fairly large periods can be quite simple, such as our pendulum.
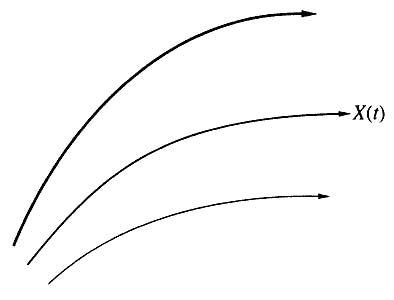 |
Рис. 2. Расходимость фазовых траекторий в системах с динамическим хаосом.
|
The pendulum is equipped with small magnets to offset friction, and the toy’s base contains a coil and a battery, which produce an electromagnetic field.
American meteorologist E.N. Lorenz realized, again in 1963, that sensitivity to initial data leads to chaos. He asked himself the following question: why is it that the rapid development of computers, mathematical models, and computational algorithms has failed to produce a method for making reliable weather forecasts for the medium term of two to three weeks ahead of time? Lorenz proposed a simple model of air convection, which plays a significant role in atmospheric dynamics. The model is described by seemingly simple equations [1]:
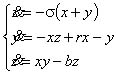 |
where the variable x characterizes the field of velocities, and y and z, the temperature field of liquids. Here, r = R/Rc, where R is Rayleigh number, and Rc is its critical value; s is Prandtl number; b is a constant related to the geometry of the problem.
Subjected to computer analysis, Lorenz’s system yielded a fundamental result: dynamic chaos, i.e., nonperiodic motion in deterministic systems, where the future is uniquely determined by the past, has a finite forecast horizon.
In mathematical terms, any dynamic system, whatever its modeling object, describes the motion of a point in phase space. A key characteristic of this space is dimensionality or, put very simply, the number of quantities that must be given to define the system’s state. From the mathematical and computational points of view, it matters very little what these quantities are: the number of lynxes and hares in a territory, variables describing solar activity or a cardiogram, or the percentage of voters supporting a president. If we assume that a point moving in a phase space leaves a trail, dynamic chaos will be represented by a tangle of paths, such as the one in Fig. 3. Here, the dimensionality of the phase space is limited to three (space x, y, z). In 1971, D. Ruel and F. Tuckens proposed a name for steady-state oscillation: a strange attractor. J.H. Poin-care’s prophecy that it would be possible to predict new physical phenomena from the general mathematical structure of the equations describing these phenomena was made a reality by computer experiments.This computer-produced picture (the calculations were made with r=28, s=10, and b=8/3) convinced E. Lorenz that he discovered a new phenomenon, dynamic chaos. This tangle of paths, which we now call the Lorenz attractor, describes a nonperiodic motion with a finite forecast horizon.
The Lorenz system has a finite forecast horizon. The fact is that if we take again the two close paths shown in Fig. 3, we find that they diverge (as in Fig. 2). The rate of divergence is defined by the so-called Lyapunov index, and the time interval for which a prediction can be made depends on this quantity. Every system can be said to have its own forecast horizon [2, 3].
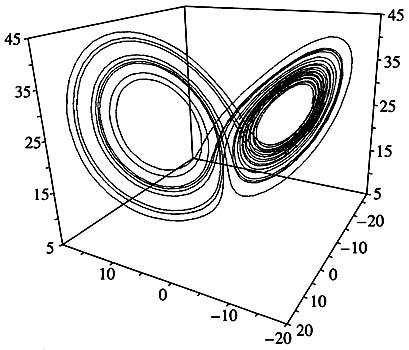 |
Рис. 3. Аттрактор Лоренца.
|
The progress of science shows that every new fundamental theory not only opens up new possibilities, but also strips us of illusions. Classical mechanics divested us of the illusion of being able to devise a perpetual motion of the first kind, thermodynamics of the second kind, quantum mechanics; and that we can measure arbitrarily closely the coordinates of a microparti-cle and its momentum and relativity theory, that information could be transmitted in a vacuum at superlight velocity. Today, nonlinear dynamics shatter the illusion of global predictability: starting with a time horizon, we can no longer predict the behavior of many fairly simple systems, e.g., our pendulum.
Lorenz’s paper was published in a meteorological journal but. remained unnoticed for ten years. Today’s meteorologists believe that the weather forecast horizon does not exceed three weeks. In other words, no matter how closely we measure atmospheric parameters, it is generally impossible, using available instruments, to predict the weather at a particular location three weeks from now. Experts estimate, the forecast horizon for the ocean to be one month.
Today, many experts in solar physics speculate that the same is true for the Sun. For example, there is a phenomenon called the Maunder minimum, which refers to a period of nearly 70 years during which there have been no bursts of solar activity. The question arises; as to whether we can predict the next similar minimum in ‘ solar activity. The work in progress, the Lyapunov indices, and the forecast horizons being what they are, this prediction cannot be made for decades ahead.
However, nonlinear dynamics brought out not only fundamental difficulties, but also new and wonderful possibilities. Let us focus on one of them. Let us try to find out how many quantities we need to describe the behavior of our simple pendulum. Classical science maintains that an infinite number of quantities is needed. A pendulum does obey the laws of mechanics, but if this toy is to rotate and not stop because of friction, an electromagnetic field has to be produced. Technically, our pendulum has an infinite number of degrees of freedom.
Nonlinear dynamics, when applied to the analysis these kinds of systems, helps us to establish how many variables are needed for their description, how many descriptions are necessary for prognostication, and also the kind of monitoring required. It turns out that such a system requires ten variables at least. This opens up new possibilities. We have what is technically a very complex system, and we need to isolate its essentials. Whereas in the 1960s, systems analysis, which considered the general properties of systems and appeared in them as entities, was all the rage, today systems synthesis holds sway at the Keldysh Institute of Applied Mathematics. This synthesis makes it possible to extract from a host of variables exactly what is needed for decision making.
Having established that there are essential limitations in prognostication, new generations of models and algorithms were developed, and forecasting became an industry. What we witness today is a leap in forecasting not unlike the one that occurred with the advent of personal computers. Before the PC age, computers were immense and costly systems which only the very large companies could afford to have. With the coming of PCs, computing became affordable to very many. The same is happening in the field of forecasting. Forecasting is ceasing to be a science and is becoming a technology. In the past, it was the RAND Corporation and a few other teams that made predictions for the US government and other entities, whereas now even not: particularly large firms keep laboratories engaged in forecasting or, to use a current phrase, «future design.»
Dynamic chaos made it possible, on several occasions, to diagnose grave diseases from electrical activity data by using fairly simple algorithms, and to propose new algorithms for information compression and protection. Economic forecasts, relying on the ideas of chaos and strange attractors, became a burgeoning activity. Mention must be made of the nonlinear journals: Physica D, Chaos, Physical Review E, Izvestiya Vuzov: Applied Nonlinear Dynamics, and Nonlinearity. It turned out that, viewed in the prognostication perspective, there is more to link the objects of different disciplines than to dissociate them.
|
Yes, a man is mortal, but this is only half the trouble. What is worse, sometimes he is mortal all of a sudden: that’s the trick of it!
M.A. Bulgakov, Master and Margarita |
Forecasting research is currently concentrating on the description and prediction of the rate of catastrophic events. J. Van’t Hoff, one of the fathers of modem chemistry and the first Nobel Prize winner in chemistry, in his day said, «I removed from my works everything that is difficult to observe or happens rather rarely.» Today’s information technologies provide us with capabilities that enable us to turn to the analysis and forecasting of rare catastrophic events.
Here is an example showing that all kinds of catastrophic events must obey the same laws. Curves of behavior of characteristics describing two complex hierarchic structures, a stock exchange and a tectonic fracture, just before a catastrophe, exhibit fast catastrophic growth, on which accelerating oscillations are superimposed (Fig. 4). The smoothed curve is finely described by the formula
|
|
that is to say, we have one and the same solution of equations that are yet unknown. Note that the asymptotics of such processes prior to the catastrophe is the so-called aggravating mode (where one or more quantities describing a system grow to infinity within a finite time). This class of modes has been studied by a scientific school that has formed, under the guidance of one of the present authors, at the Keldysh Institute of Applied Mathematics [6].
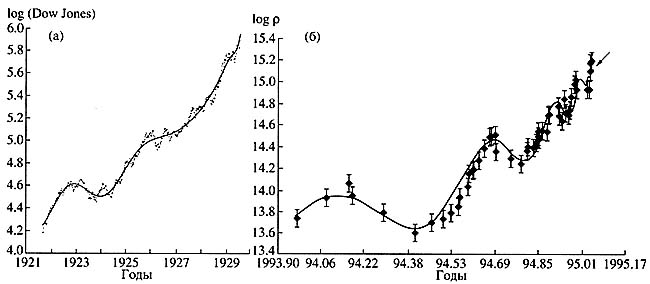 |
Рис. 4. Характерный вид зависимости, возникающей перед катастрофами в сложных системах. а — зависимость от времени логарифма индекса Доу-Джонса (этот индекс определяется ценой самого эффективного пакета акций 30 ведущих компаний Соединенных Штатов) перед Великой депрессией [4]; б — зависимость от времени логарифма концентрации ионов хлора в родниках перед катастрофическим землетрясением в Кобе (Япония) в 1995 г. [5]. Точки — это точные данные, сплошная кривая — сглаженная зависимость, построенная по ним |
John von Neumann once said, «I do not believe that we can find genera! laws in the behavior of complex systems. It is the same as building a theory of non-elephants.» The development of nonlinear dynamics refuted this assertion. Nonlinear dynamics succeeded in establishing general scenarios of the origination of chaos from an ordered state [3]. Current developments in science suggest that in some cases, we can speak of some general scenarios of the inception of catastrophes.
Some thirty years ago, Feynman was asked, «If all the living physicists were to die tomorrow, leaving a single phrase for posterity, what would you say?» «The whole world consists of atoms and the void,» said Feynman. «They will think out the rest.» If this question were to be asked of all scientists and not only physicists, the phrase should probably be worded differently:
«Leam risk management.» Risk management is one of the key technologies of our civilization [7, 8]. It corresponds to the main road of progress: to trade some threats and dangers for others. For instance, to trade the danger of starving and freezing for the risk of reaping the fruits of the pollution of the water, air, and earth owing to the operation of thermal or nuclear stations.
According to the normal (Gaussian) distribution, large deviations are negligibly rare. However, many disasters, accidents, and catastrophes generate power-series distribution statistics, which decreases slower than the normal distribution, therefore catastrophic events cannot be neglected. In the logarithmic scale (below), power dependences acquire the form of straights.
It should not be thought that tertium non datur and that we can only go with the tide. There are alternatives. Sweden resolved to forgo nuclear power engineering as an overly hazardous technology. In France, on the other hand, where more than 70% of electricity is produced by nuclear stations, the government is contemplating a boost to this industry as a major way to conserve the environment. The stakes are high and the discretionary power is quite great.
It was quite recently that the deep connection between nonlinear dynamic notions and risk management became clear to us. The paradoxical statistics of accidents helped us to realize this. Remember the Titanic, Challenger, Chernobyl, Three mile, Bhopal… Each of these major catastrophes of the 20th century is associated with a long cause-effect chain, an «unfavorable set of many unlikely incidentals,» to use the usual wording of state commission reports. As a matter of fact, an evildoer plotting something along these lines would have a hard time of it. As one inspects these disasters, one has a persistent feeling that we are simply having a long run of bad luck.
What is the mathematical form of this «bad luck?»
The word random already been used once. In the early 19th century, K.F. Gauss established that the sum of the independent, identically distributed, random quantities obeys a certain law. The corresponding curve, obtained after normalization, is shown in Fig. 5. It can be seen to rapidly decrease; large deviations are very rare under this law. So rare, in fact, that they can be ignored.
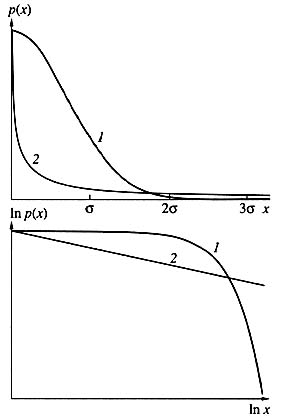 |
Рис. 5. Типичный вид нормального (1) и степенного (2) распределений.
|
The Gaussian distribution underlies a host of engineering calculations and design codes. Every engineer knows the three sigma rule. It says that the probability of a random quantity deviating from the mean by more than three sigmas is less than 0.001 (see Fig. 5). The sigma here is mean-square deviation. A simple example: people’s heights are distributed according to the Gauss law; hence, we can ignore with a light heart the likelihood of coming across a three-meter-high giant.
But there is another class of laws called power laws (see Fig. 5). The tail of this distribution decreases much slower, therefore such laws are often referred to as «heavy-tail distributions.» Here, large deviations cannot be ignored. If people’s heights were distributed according to this law, it would be the world of oriental fairy tales, where ordinary mortals could easily encounter thirty-meter jinn, ifrits, and divs. It is in this world of oriental fairy tales that we usually find ourselves when we face disasters, catastrophes, and accidents. This is according to the statistics for earthquakes, hurricanes, nuclear arms stocking incidents, market crashes, damage from confidential information leaks, and many other tribulations.
To show that these are not mere assertions, here are the American statistics for tornadoes, earthquakes, floods, and hurricanes in the past century (Fig. 6). We can see that these observations fall, with a sufficiently high accuracy, on the curves corresponding to the ideal power statistics.
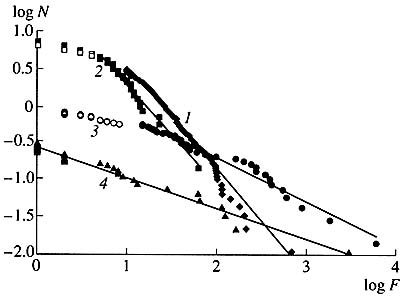 |
Рис. 6. Распределение торнадо (7), наводнений (2), ураганов (3) и землетрясений (4) по количеству погибших в них в США в XX в. По оси абсцисс отложена фатальность F стихийного бедствия, измеряемая логарифмом числа погибших, по оси ординат — логарифм числа бедствий N, имеющих фатальность не меньше данной. Идеальным степенным законам соответствуют прямые. Видно, что эти законы являются хорошим приближением для реальной статистики бедствий и катастроф |
When we decide whether or not to undertake a particular engineering project, we can use any of a variety of approaches. The first is one that was realized and perfected already in Columbus’ time: determine all possible outcomes, N, multiply their probability pi by the corresponding rewards or losses, xi and sum up:
 |
Depending on what quantity results, we either undertake or forsake our project.
Note that Columbus’ expedition was the only one to travel to the New World at a treasury’s expense. After him, business houses in Spain engaged in the insurance and reinsurance of such projects, for the financial risks were too high for any business house. However, the rewards were also high. A historical anecdote: following his expedition to the New World, F. Drake gave a present to the queen of England which equaled two annual budgets of England. The queen paid off all her debts. There are indeed very many dangerous, but also very profitable, projects in our world. That was the foundation, laid even in Columbus’ time, which provided the foundation for the assessments of very many engineering initiatives up until the 1950s.
However, a paradox was noticed as early as the 18th century. Let us picture a game of heads or tails. If it is heads, you receive two gold ducats, and the game ends. If it is heads again, you receive four gold ducats, and the game ends; if a third heads occurs, your receive eight ducats. The sum 5,, which is part of the Columbus algorithm, is infinite. The question is how much one is prepared to pay to join the game.
Jacob Bernoulli, while watching such a game in St. Petersburg, was amazed at the fact that people were not prepared to pay more than 20 ducats to join. When one estimates the odds and decides if it is worth a try, one, according to Bernoulli, does not act according to the Columbus algorithm. What one estimates is not real winnings but the winnings utility:
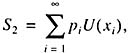 |
where U(xi) is a utility function. If you have one ruble, 100 rubles are great winnings for you. If you have 1000 rubles, you value 100 rubles much less, their utility for you being much lower. In the mid-20th century, von Neumann showed that the Bernoulli algorithm is good for economic behaviors in a great many cases.
However, subsequent studies of economic behavior, notably the work of M. Alle and his school, indicated that in many cases, people employ a different, more complex decision making algorithm. A person deals not with the Bernoulli formula, but with a formula including not just a utility function, but also subjective probabilities f(pi), which reflect our notion of danger [9]:
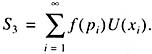 |
The abscissa is the fatality F or a natural disaster, measured by the logarithm of the number of disasters, N, with a fatality not less than a given one. Ideal power laws are matched by straights. It can be seen that these laws are a good approximation to the real-life statistics of disasters and catastrophes.In the case of «Gaussian disasters,» there are design, extradesign, and hypothetical accidents. The likelihood of the first is determined by the area of the curvilinear trapezoid ABEF, the extradesign, BCDE, and hypothetical accidents, the area of the path behind the curve to the right of line DC. For visualization purposes, the areas corresponding to extradesign and hypothetical accidents are greatly enlarged.
Psychologists contend that if one is told that the risk is Jess than 10У6 a yearУ1, one is bound to simply ignore this possibility. In other words, in order to analyze projects, we need to have a certain system of estimates.
In the 1950s, it was presumed that if people have sufficient training and are paid regularly, they can ensure the absolute safety of any installation. But the ‘State Scientific and Technological Program «Safety» (managed by RAS Corresponding Member N.A. Makhutov) demonstrated that the course prevailing the world over is more preferable for isolating design, extradesign, and hypothetical accidents (Fig. 7). The consequences of design accidents (for which there is a certain likelihood) are to be removed by the company itself. The consequences of extradesign accidents (which have their own likelihood) are to be liquidated by the Ministry of Emergencies and the appropriate organizations best suited for accomplishing it. As for hypothetical accidents, their likelihood was thought, until recently, to be negligible.
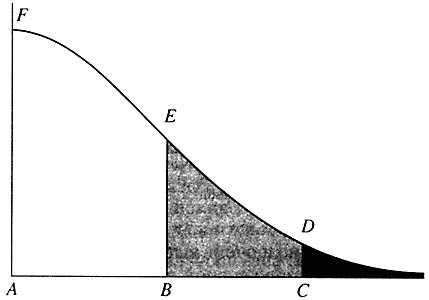 |
Рис. 7. Типичная схема оценки аварий. В случае «гауссовых бедствий» выделяют проектные, запроектные и гипотетические аварии. Вероятность первых определяется площадью криволинейной трапеции ABEF, запроектных — BCDE, гипотетических — площадью участка под кривой, лежащим справа от линии DC. Для наглядности площади, соответствующие запроектным и гипотетическим авариям, на рисунке значительно увеличены |
Much that was designed in this country was based on this supposition, from weapon systems to nukes. It turned out that the assumption of Gaussian statistics leads to the inference that the probability of a nuclear power station accident is 10У7 a yearУ1, that is, one accident in 10 million years. However, recent studies demonstrated that in each of these cases, we deal with power statistics. Therefore, our estimates must be quite different. In the event of power disasters, we should count on the worst. To give you an idea of the scale of rare catastrophic events, here are some episodes from the 20th century history. During the 1931 flood of the river Yangtze in China, 1.3 million people died, and during the Tian Shan earthquake of 1976, about 650000. The 1970 flood in Bangladesh cost more than 500000 people their lives and left 28 million homeless [8].
The essence of risk management is connected not only with the description, statistics, and understanding of mechanisms, but also what in some cases can be termed precursors. This kind of behavior is exemplified by a curious phenomenon called hard turbulence. It was discovered in plasma physics in the 1970s and more recently, in a variety of reaction-diffusion type systems. Let there be a quantity that changes chaotically but sometimes makes gigantic leaps (Fig. 8).
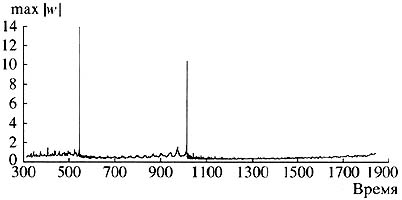 |
Рис. 8. Типичная картина при возникновении жесткой турбулентности. На «хаотическом фоне» изредка возникают гигантские пики |
For such model problems we can identify precursors that signal danger. Nothing has occurred yet, and disaster is very remote, but a certain slowly changing variable already indicates that we have entered a danger zone (Fig. 9).
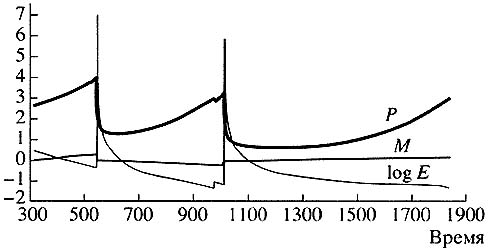 |
Рис. 9. Изменение медленных переменных Р, М и logE — перед гигантскими пиками. Наиболее важна с точки зрения предупреждения катастрофических событий переменная М |
Today, such things arc being sought for many real-life systems.
A number of steps in the development and application of risk management theory is being taken within» the framework of a federal goal-oriented program, initiated by the Russian Ministry of Emergencies, to prevent and mitigate the aftereffects of emergencies in natural and anthropogenic environments. The program focuses on forecasting and preventing disasters and catastrophes because, in economic terms, forecasts and preventive measures cost dozens, sometimes hundreds, of times less than the liquidation of the consequences of past calamities. However, the scale of these efforts in Russia does not seem to match their importance. A broad multidisciplinary approach is in order here, as well as a much more active contribution from the Academy of Sciences. Many things must be reviewed and reappraised.
The complexity paradigm and the theory of self-organized criticality
|
Where do power statistics come from? This question is answered by a new paradigm of power dynamics, the complexity paradigm, and the theory of self-organized criticality which was developed within its framework [10, 11].
Power dependences are characteristic of many complex systems: earth crust fractures (the famous Richter-Gutenberg law), stock exchanges, or the biosphere during the evolutionary time periods. They are typical of highway traffic, computer network traffic, and many other systems. What all of them have in common is the emergence of long cause-effect relations. One event may lead to another, a third one, and then an avalanche of change affecting the whole system. For example, mutation, which with time changes the appearance of a biological species, affects its ecological niche. A change in the ecological niche of this species will, naturally, affect those of other species. They will have to adapt. The end of this avalanche of change, leading to a new equilibrium, can be long in the coming.
A sand hill is a simple physical model demonstrating this kind of behavior. Imagine the following picture: We drop a grain of sand upon the top of the sand hill. It either stays there or slides down, causing an avalanche, The avalanche may have one or two grains of sand, or it may have very many. The statistics for a sand hill proves to be power-type, as is the case for a number of disasters and catastrophes. It is like the statistics that we have for, say, earthquakes; in other words, the danger is at the boundary between determinist and stochastic behavior or, to use a current phrase, at the edge of chaos.
Studies of complex systems demonstrating self-organized criticality showed that such systems, on their own, seek a critical state, which is possible with avalanches of any scale. Because this kind of system includes the biosphere, society, various infrastructures, the military-industrial complex, and a host of other hierarchic systems, the findings of the theory of self-organized criticality are very important for the analysis of control action and the development of methods for their prevention and destruction.
Extensive work on the complexity paradigm and its forecasting applications is in progress the world over. The newly established Institute of Complexity in Santa Fe, New Mexico, is an example. It is headed by M. Gell-Mann, a recipient of the Nobel prize for physics, and has on its staff B. Arthur, a winner of the Nobel prize for economics. The institute engages itself in a variety of tasks, from disaster prediction and computer simulation of economic processes to scenarios of the destabilization of political regimes and artificial life [12]. In Russia, the work conducted on the complexity paradigm is at our institute and other RAS institutes. However, its scale is a far cry from what is needed.
How can we predict?
Nature, whatever it should be, Was coauthored by the devil- This is the whole point.
|
If prediction is so difficult, even when based on the use of state-of-the-art computer techniques, how can we successfully reason in this complex and changing world of ours? How do we manage to act in a reasonable way despite a very modest time horizon? A theory of riverbeds and jokers, which is under development now, attempts to give answers to these questions, and hence, forecast algorithms.
George Soros, the well-known financier, is credited (rightfully) to be one of its authors. In his Alchemy of Finance he put forward the idea of an «informational» or «reflexive» economy. According to this idea, variables such as credibility level, expected profit, and many others, which describe our virtual reality, play a , key role in today’s economy. It is thanks to these variables that grand financial pyramids can be built and afterwards destroyed. But these variables can change quickly, something which is quite alien to mathematical models built in the natural sciences.
In other words, in the phase space of many entities with which we deal in our daily life, there are places called joker fields, in which chance, a game element, or a factor of no consequence in any other situation can turn out to be decisive and not only affect the future of the system but even shift it in a stepwise fashion to another point in the phase space. Joker refers to the rule by which this step is made. The name was borrowed from card games. The joker is a card that a player can substitute for any other card in the pack. Obviously, this greatly increases the number of variants and the degree of uncertainty.
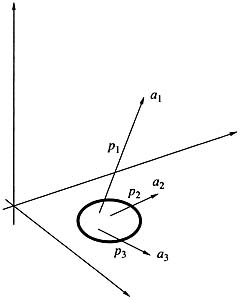 |
Рис. 10. Система с руслами и джокерами.
|
Picture appearing in a problem with a destroyed bank. The small area inside the circle corresponds to the joker area, where serious action has to be taken.
Consider a simple example. Let us assume that we own a small bank. Business is going from bad to worse, and how can it be otherwise in an age of crisis? A decision must be made. The first, and most natural decision (which is taken with the probability p1, whereby the system abruptly goes over to a phase space point a1 Fig. 10) is to stage a presentation at the Hilton: publicity, journalists, new clients, and opportunities. The second is to act like all honest men and declare ourselves bankrupt (probability p2 and correspondingly, point a2). Finally, we can consider our nearest and dearest and get away with the remaining cash, to preach to local reformers from across the Atlantic (probability p3, and point a3). We can see that we have time and again a symbiosis of dynamics, predetermination, and chance.
We can translate the following into the language of medicine. Away from the joker area, therapy must produce an effect, whereas only surgery can be effective within the area itself. The situation in this case can change rapidly and radically.